
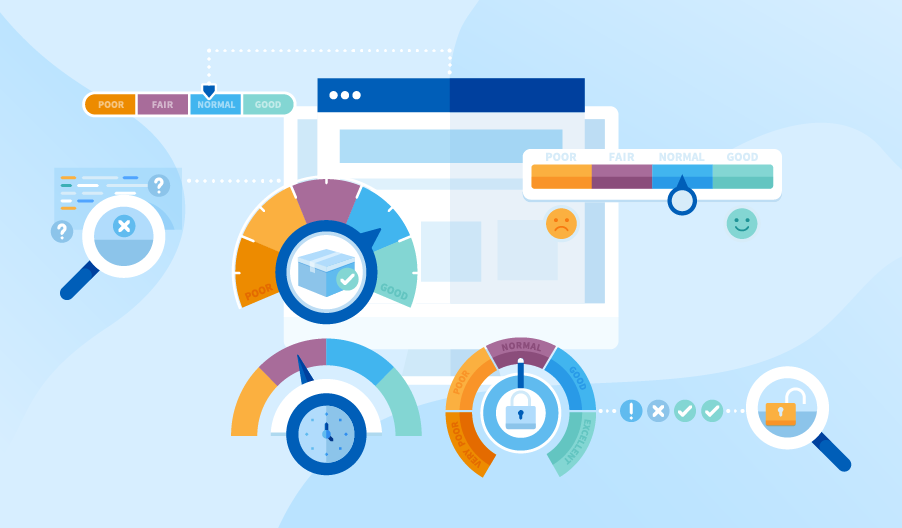
Engineering Health & Sustainability Metrics: Measuring the System That Builds the System
- Craig Risi
- Mar 27
- 5 min read


Building software is not just about technical decisions or the mechanics of designing, building, and maintaining systems. At its core, great software is created by healthy teams operating within healthy systems. The quality of what gets delivered is deeply influenced by the environment in which people work, the sustainability of their workload, the clarity of priorities, and how well the system supports them in doing their best work over time.
While flow, quality, reliability, and predictability metrics help us understand what is being delivered, engineering health and sustainability metrics focus on how it is delivered - and, more importantly, whether that pace and quality can be sustained. They provide insight into the human and systemic factors that underpin delivery, such as workload balance, technical debt, team stability, and the ability to learn and improve.
These metrics play a critical role in helping organisations avoid burnout, technical decay, and delivery fragility. By surfacing early warning signs of systemic stress, before they become visible failures, they enable leaders and teams to take proactive action. The result is not just better software, but a more resilient, engaged, and high-performing engineering organisation over the long term.
Why Engineering Health Metrics Matter
Engineering health is the foundation of sustainable delivery. You can push teams to move fast for a short time, but without visibility into their long-term well-being and system load, performance will eventually collapse.
Without engineering health metrics:
Teams burn out: Constant pressure, unrealistic workloads, and operational overload drain energy and creativity. Burnout reduces quality, increases attrition, and destroys team continuity.
Knowledge becomes siloed: When only a few people understand critical systems, delivery becomes fragile. Progress slows when key individuals are unavailable, and risk increases with every change.
Technical debt accumulates silently: Without tracking rework, shortcuts become the norm. Over time, systems become harder to change, more expensive to maintain, and more prone to failure.
Delivery slows over time: Teams appear “busy,” but progress decreases as friction, rework, and interruptions grow. Speed becomes unsustainable and unpredictable.
Quality and morale decline: When people are stretched too thin, defects rise, innovation drops, and trust erodes, both within teams and with stakeholders.
Building for Sustainability
Sustainable delivery requires systems that support people rather than exhaust them. Engineering health metrics help leaders detect early warning signs, balance workloads, protect learning time, and invest where friction is highest.
When teams are healthy, they don’t just deliver more, they deliver better, for longer, and with confidence.
Core Engineering Health & Sustainability Metrics
Below are some core metrics that can help identify the sustainability of your engineering efforts. Engineering health is the foundation of sustainable delivery. When these metrics are visible and acted on, teams don’t just ship faster — they stay motivated, resilient, and capable of continuous improvement.
Workload Balance
What it measures: The distribution of work across teams and individuals.
Why it matters: Uneven workload leads to burnout and delivery risk.
Use case: Identify teams or services with persistent overload.
How to measure it:
Count active work items per engineer or per team.
Track average WIP per person and per service.
Calculate variance or standard deviation across teams.
Highlight sustained outliers over multiple sprints.
Technical Debt Ratio
What it measures: The proportion of effort spent on maintenance and rework versus new features.
Why it matters: Rising debt slows innovation and increases risk.
Use case: Justify refactoring and platform investments.
How to measure it:
Tag backlog items as new feature, defect, refactor, or maintenance.
Technical Debt Ratio = (Maintenance + Rework Effort) ÷ Total Engineering Effort
Track sprint by sprint to spot trends.
Knowledge Concentration
What it measures: How many people can safely change critical systems.
Why it matters: High knowledge silos create fragility.
Use case: Encourage pair programming and documentation.
How to measure it:
Identify critical services or components.
Count unique contributors to each system over time.
Track the “bus factor” (number of people required to keep a system running).
Flag systems with only 1–2 active maintainers.
Context Switching Index
What it measures: How often engineers change tasks or projects.
Why it matters: Excessive switching reduces quality and focus.
Use case: Limit WIP and stabilise team priorities.
How to measure it:
Track the number of concurrent active items per engineer.
Count how often items move back and forth between states or projects.
Context Switching Index = Active Items per Person ÷ Ideal WIP Limit
Monitor weekly trends.
On-Call Load
What it measures: Incident volume and after-hours interventions.
Why it matters: High operational burden leads to fatigue and attrition.
Use case: Improve system reliability and automation.
How to measure it:
Count incidents per on-call engineer per month.
Track after-hours pages and escalations.
Measure average recovery time per on-call rotation.
Identify services generating the most alerts.
Engineering Engagement Score
What it measures: Sentiment from internal surveys and feedback.
Why it matters: Engaged teams produce higher quality outcomes.
Use case: Track morale trends and leadership effectiveness.
How to measure it:
Run quarterly or biannual anonymous surveys.
Use standard engagement questions (e.g., satisfaction, psychological safety, growth).
Score results on a 1–5 or 1–10 scale.
Track changes over time and by team.
Learning Investment
What it measures: Time spent on training, experimentation, and improvement.
Why it matters: Learning fuels innovation and adaptability.
Use case: Protect time for growth and technical excellence.
How to measure it:
Track hours logged against training, R&D, and improvement tasks.
Learning Investment = Learning Hours ÷ Total Engineering Hours
Monitor per team and per quarter.
Sustainability Is a Strategic Advantage
Sustainability in engineering is not about slowing down; it is about building the capacity to move fast without breaking people or systems. Organizations that treat sustainability as a strategic priority consistently outperform those that rely on short-term heroics.
Healthy engineering systems deliver faster, safer, and for longer because they reduce friction instead of creating it. When teams are supported with realistic workloads, reliable tooling, clear processes, and space to learn, they make better decisions, recover faster from failures, and produce higher-quality outcomes.
Engineering health metrics ensures that improvement is compounding, not extractive. Rather than squeezing more output from already strained teams, these metrics highlight where investment, automation, or simplification will unlock sustainable gains. Over time, this creates a culture of continuous improvement, where progress accelerates naturally because the system itself is getting stronger.
In this sense, sustainability is not a cost; it is a competitive advantage. Organizations that protect their people and platforms today are the ones still innovating tomorrow.
Closing Thought
You cannot optimise delivery by exhausting the people who deliver it. Engineering health and sustainability metrics ensure your delivery engine remains resilient, adaptable, and human: now and into the future.


I appreciate this article... it is indeed true that trying to move forward with speed and precision while there is so much technical debt is difficult.